1. Cree CREE, $42.93
Its low 2019 guidance in its last earnings report (despite beats sales and EPS inline) plunged the stock from its comfortable $55-65 ($69.21 at highs) range since May to $43-45 levels, evaporating all its year gains. Its year pivot point is at $41.78 so it's worth keeping an eye there for its reaction at that level: if it rebounds or continues its falling to $40.84, its YTD low.2. Dropbox DBX, $17.90
Same as Cree, lowered its guidance in its last earnings report, and the stock price sank more than 20%, verifying that Wall Street is yet reluctant this year to these cloud companies like Box or VMWare, both at year lows. Its recent all-time low at $17.20 is the level to check. Last week MACD bullish cross with low volatility gives some hope that this stock is rebounding now.3. Disney DIS, $137.26
A winner-stock for this year, completes its pullback from $147.15, its all-time highs, and last week began its bouncing. At $137.60 is it month pivot point, the next resistance for this week. Hold this stock, even until 2020.4. Fiserv FISV, $106.94
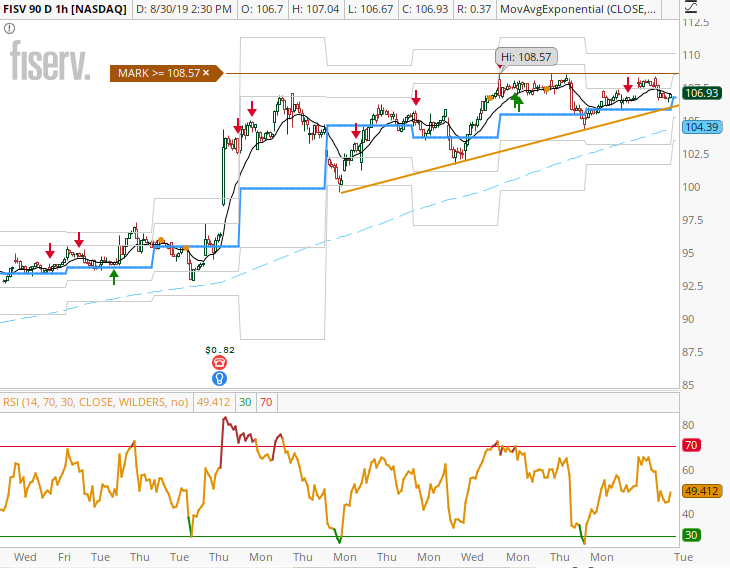
I continue long in Fiserv since I recommend this stock in January when they complete its First Data acquisition. Great performance this year. Is natural next resistance is its all-time highs at $108.57. In its 1-hour chart, an ascendant triangle was formed, so we have here also a support for the next sessions.

The 1-hour chart of Fiserv FISV, showing a bullish ascendant triangle. It's great to do trading when a pattern appears in a chart because support and resistance levels are very clear.
5. Gilead Science GILD, $63.54
All 2019 its price is ranging in a symmetrical triangle with very strong support, below its SMA200 average. Its year pivot point is at $70.80. I look a bearish bias for this biotech stock, as all this subsector (XBI flat all the year).6. Illumina Inc. ILMN, $281.34
Now in a bearish trend due to its recent earnings report that didn't satisfy Wall Street. It beats EPS (but less YoY), miss revenues and widely lowers its guidance for 2019. Analysts punished the stock with several cut-price targets and a downgrade by Cannacord. Now is trading more than 25% below its July all-time highs, and below its year pivot point at $293.35, being $268.62, its YTD lows, its next support.
7. The Kroger Co. KR, 23.68
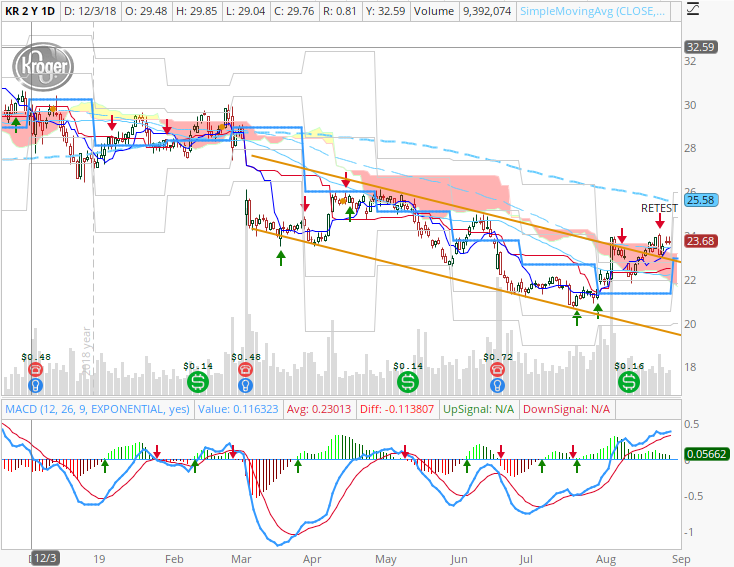
Keep an eye on retail sector, I wrote recently, as it could fuel the next bullish rally in Wall Street support in good July Retail Sales reports. Despite increasing tension in the Trade War, this sector seems improving last week, and the food retail Kroger, due to its less exposition to China, seems an interesting choice. Recently breaks the resistance of its bearish downtrend channel in its daily chart, also retesting it. Now price moves above its Ichimoku cloud and two main SMA averages: 50 and 100. September 12th. reports its Q2 earnings and could mean a turn in its bias. $24.82 is my target, before earnings.

Daily chart of Kroger KR, showing recent break of its bearish channel. Next days the price returns to that level with lower volume (reaction) and then rebounds there (resolution) filling the three phases of a successful breakout.
Good Trading!
@BravoTrader
{fullWidth}
Tags:
Watchlist
