

The yield curve, is taking critical importance in these months for investors and traders because it's now completely inverted in almost all of its spreads, that's short-term yields are exceeding long-term yields, an infallible and irrefutable signal that a recession is looming, or it's now here.
The Theory
The yield curve is simply formed on an XY chart with the maturity times of the US Treasury Bond on one axis and the interest rates on the other. Understanding how this curve is drawn, its types (normal-reverse-flat-humpback), its inclination (steep or flat), and its relationship with the market, is now key for investors, as it will allow us to make better financial decisions.
Also knowing its basic principle: the direct influence of the short-term yield bonds is the interest rate assigned by the Fed, while the long-term ones depend, also directly, on inflation and how it is eroding the value of the bonds in time.
- In an expansive cycle, there is a steeper yield curve, as it is obvious that, at a longer time, higher yield is expected through a higher interest rate. In a practical way, banks use short-term borrowing to fund long-term loans, as it's profitable for them.
- In a tightening cycle, a flattening occurs in the yield curve as the differential or spread between the extremes approaches. Banks become less likely to lend, a signal that the economy is entering a recession.
- The most critical case for the economy is when the yield curve inverses: in fact, all US recessions, since WWII were preceded by an inverted yield curve.
In StockCharts you can observe, dynamically, the yield curve vs the SP500 index at any moment. Verify its inverted/flattened form in recent months, due to current aggressive Fed rate hikes, here: https://stockcharts.com/freecharts/yieldcurve.php
 |
A great dynamic visual representation of the Yield Curve behavior in time. Go to the StockCharts link (above) and simply hover in the SPX chart (right) and in the left chart visualize the Yield Curve for that specific date. As you see, now its completely inverted. |
Yield Curve Behavior
Depending on the state of the economy, and Fed's rate decisions, four cases can occur, in a cycle:
1. Bull Steepener: occurred, for example, after the subprime crisis in 2008 or in the COVID 2020 one, when the Fed became dovish and in order to heat the economy, began to lower rates, almost to zero, so the short-term i-rate fell faster than the long-term. Notice that a bubble was created in the price of the short bonds, that exploded this 2022, with its market capitulation still seen now, while the stock market is still in denial mode.
1. Bull Steepener: occurred, for example, after the subprime crisis in 2008 or in the COVID 2020 one, when the Fed became dovish and in order to heat the economy, began to lower rates, almost to zero, so the short-term i-rate fell faster than the long-term. Notice that a bubble was created in the price of the short bonds, that exploded this 2022, with its market capitulation still seen now, while the stock market is still in denial mode.
In 2023H2 or 2024 will see the yield curve steepens again, restarting a typical economic cycle
2. Bear Steepener: it´s seen when appears an increase in inflation and Fed rate hikes were foreseen. The steep slope was a sign of an expanding economy, as it happened from mid-2021.
3. Bear Flattener: occurs when the Fed adopts a more hawkish tone and short-term rates rise faster than long-term rates. The slow pace with which inflation advances flattens the curve, with the risk that it will reverse, which is a sign of the beginning of a recessive cycle. It's the cycle we are in all of 2022.
4. Bull Flattener: after a recession, reactivation is appreciated when the influence of inflation decreases in long-term rates, and these fall faster than short-term ones. It is usually a good time to buy long-term bonds, as Fed begins its rate cuts, likely in 2023H1, inflation-data depending.
 |
| A visual summary of the 4 types of Yield Curve, taken from an article by Felix Baruque. Understanding these facts is decisive to invest in taking advantage of the inflation and rate data. |
The infallible 10y-2y Spread
Another easy way investors see graphically what can occur to the economy, and therefore the stock market, is by checking the differential or spread between the different bond maturities. Usually consider the most reliable recession predictor, the 10-year/2-year US Treasury Spread has a general tendency to signal the market`s expectation of an upcoming recession or a slowdown in economic growth.
Although other authors prefer to use the 3-month and 10-year bond, the fact is that now, nearly 100% of the spreads are in negative territory. And always whenever there was a recession cycle, the spread became negative a few months earlier.
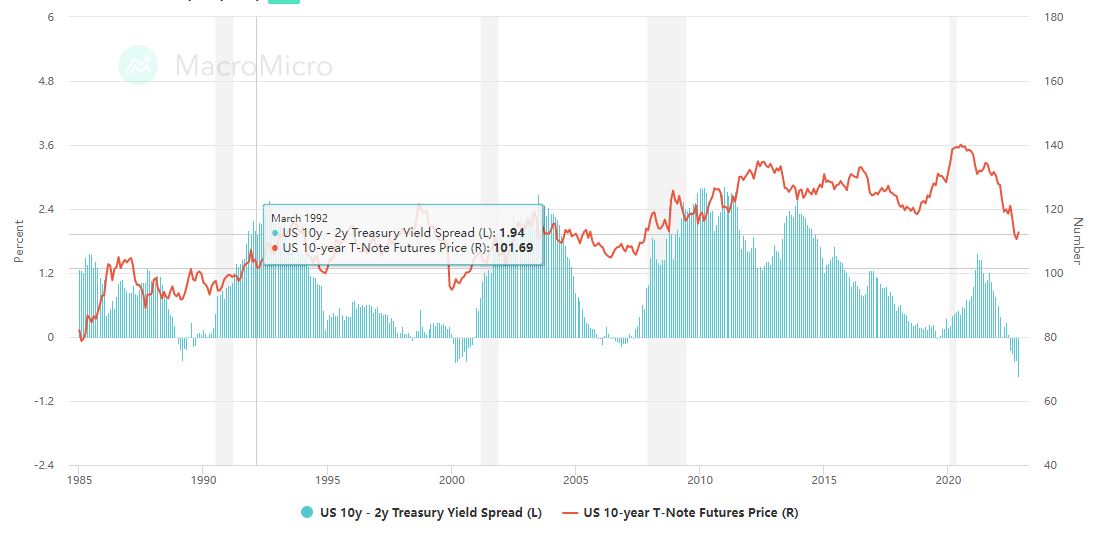 |
| In this chart, taken from MacroMicro, its clear that every US recession cycle (shadowed in grey) is preceded a few months earlier, at least a year, by a negative spread (10-year minus 2-year, below zero). Since July it became more negative than at any time since 1985, signaling a likely severe recession is going to hit us. The question is how deep it's going to be... |
My forecast for next few months
- The Fed is probably wrong when it insists on a "soft landing" or on the probability of avoiding a recession. The numbers are compelling: in the US more than 50 years ago, this behavior in the yield curve and the 10/2 spread has meant the preamble of recession, which usually pulls down the stock market.
- In fact, technically we are already in recession since there is a consensus that two consecutive quarterly GDP decreases signal the start of a recessive cycle, which occurred in the middle of the year and is conveniently ignored by the current government narrative. In contrast, the United Kingdom already openly admits it: its recession will be long and painful.
- Soon, likely in 2023H1, we will stop talking about inflation, pivot, 0.75% vs 0.5%, etc. It is clear that it reached its peak a couple of months ago and is beginning to drop slowly, although it will not go away for a long time (sticky inflation), so the Fed will maintain small rate hikes of 0.25% until it reaches equilibrium with the inflation number. We will therefore speak of high inflation, in decline, and with slow economic growth, that is stagflation.
- And what's more, probably this balance will not occur in the usual target of 2% and the official narrative will say that 3% (or more) will be "the new normal".
- And finally, in 2023H2 or early 2024, everyone will talk exclusively about the recession and the Fed's rate cuts, necessary to stimulate economic growth and complete the cycle. Typically first the long-term bonds will react upwards and then the stock market, as the US yield curve always steppers as the recession begins, due to a Fed flipping from hikes to cuts. All this in the midst of a recession.
- There will appear great opportunities for the investor: for example, long small-cap stocks, long-term bonds, metals, emerging markets, or short US dollar. This will be, likely, for 2023H2.
 |
| The Fed should not deny the recession, since it is part of a healthy economic cycle, as the recent COVID one, shown in the scheme above. A recession closes the cycle, which unfortunately this time can be very painful due to its lousy expansive post-COVID policy. |
Good trading,
@BravoTrader
{fullWidth}