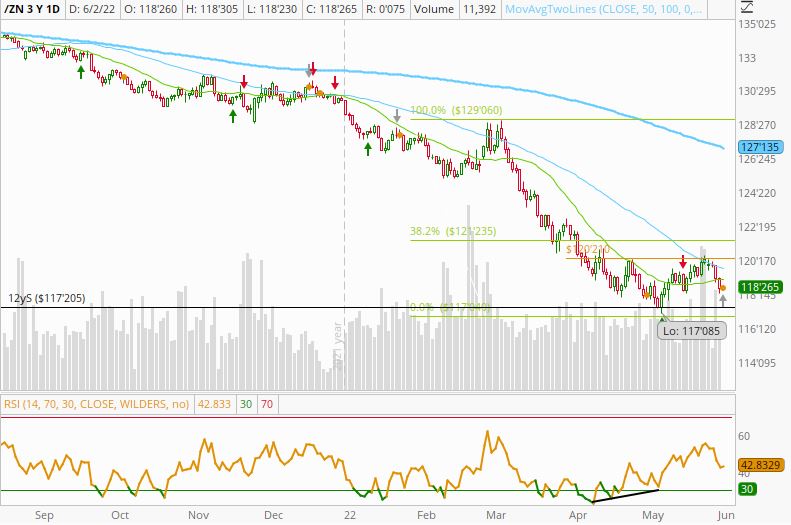
This month begins with events that will determine the market behavior for the rest of the year, by sure. Beforehand, historically, is the market's worst month (hence the popular saying "sell in May and go away"), however, better put the facts on a scale.
A Key June.
Positive facts: last week, the Fed put an end to the uncertainty on markets by setting the path, at least until July: rate hikes of 0.5% in June and July to reach an i-rate of 1.75-2%, with expectations at 2.5% in December. And in turn, the reduction of its balance sheet, or quantitative tightening QT, which will be proportionally slow so as not to affect the markets.
The market generally succumbs when it has uncertainty, and today it no longer has it, the panorama is defined, for this reason, this recent strong rebound in its stock and bond markets, and with the dollar weakening, another good sign. And if inflation actually reached its peak as speculated, the picture looks acceptable, but only for the short-term.
Negative facts: the "officially" confirmed recession (two consecutive quarters with negative GDP), the continuation of poor economic results (ISM, Retail, Housing) confirming the current stagflation (recession with high inflation), plus consumption that has been slowing down dangerously. And Q2 Earnings, the other great driver of the stock market, is coming soon, which will surely show the consequences of this economic environment: disappointing.
In the balance, it seems that the SP500 may do somewhat well in the short-term but in the mid-term, it could resume its bearish structure and go back to levels that allow me to rebuild my long portfolio. And I still think SP500 at 3500 (50% of its Fibonacci retracement) is an excellent level for it.
Levels to watch this week
The key to a successful application of Price Action Trading is to choose the appropriate support and resistance levels and wait patiently for the price to approach or reach one of them to start making entry decisions. Let's review my technical levels for the next weeks in the main indices of Wall Street, through its index futures.
Note. As a reference, in all my daily charts you will see as indicators: the RSI (in black lines its divergences), three simple moving averages: DMA200 (wide light blue), DMA50 (skinny light blue), and a quicker DMA20 (green). And the horizontal S/R levels, trendlines, and price patterns are drawn with different colors according to their term: short-term (ocher), mid-term less than 1 year (purple), more than 1 year (red), and long-term (black). Finally, the zones are in yellow. I always use different colors for a quick review at a glance.
1. SP500, close 4,097.00
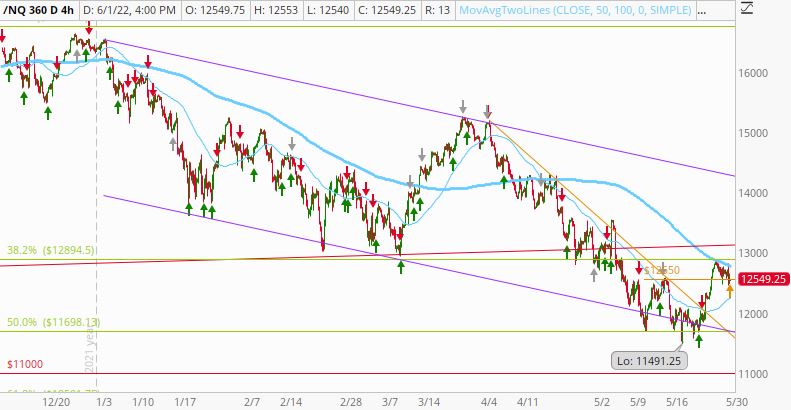
2. Nasdaq100, close 12,549.25
The Nasdaq, continues its bearish structure but much more marked, as it's more volatile than the SP500 and more hurt by the next two rate hikes. His LH-LL formation is very clear, especially on a 4-hour chart (above), giving the feeling that its plunge still has a long way to go.
3. VIX, close 25.69
It is interesting to note that since the COVID crash of 2020, the VIX average level (historically 19.5) plus its standard deviation (one and two), that is, 27.6 and 35.7, have worked very well as resistance, as seen in its daily chart. It usually makes a sharp reversal at the 35 level, which gives relief to the market, because if it clearly exceeds this, it is an indicator of a great probability of a crash.


